Ftrace is an internal tracer designed to help out developers and
designers of systems to find what is going on inside the kernel.
It can be used for debugging or analyzing latencies and
performance issues that take place outside of user-space.
https://www.kernel.org/doc/Documentation/trace/ftrace.txt
 Connected with 192.168.7.12:48148
 cpus=1
 pagesize=4096
 CPU0 data recorded at offset=0x4ba000

 debugger:~$ sudo trace-cmd report trace.192.168.7.12\:48148.dat > trace.list
CONFIG_HAVE_ARCH_KGDB=y
CONFIG_KGDB=y
CONFIG_KGDB_SERIAL_CONSOLE=y
CONFIG_KGDB_TESTS=y
# CONFIG_KGDB_TESTS_ON_BOOT is not set
CONFIG_KGDB_LOW_LEVEL_TRAP=y
CONFIG_KGDB_KDB=y
# CONFIG_RANDOMIZE_BASE is not set
Kernel hacking -> [*]KGDB: kernel debugger
Kernel hacking -> KGDB: kernel debugger -> [*]KGDB: use kgdb over the serial console
Kernel hacking -> KGDB: kernel debugger -> [*]KGDB: internal test suite
Kernel hacking -> KGDB: kernel debugger -> [*]KGDB: Allow debugging with traps in notifiers
Kernel hacking -> KGDB: kernel debugger ->  [*]KGDB_KDB: include kdb frontend for kgdb
Processor type and features -> [ ]Randomize the address of the kernel image (KASLR)
debuggee:~$ sudo echo ttyS1,115200 | sudo tee /sys/module/kgdboc/parameters/kgdboc
debuggee:~$ sudo echo g | sudo tee /proc/sysrq-trigger
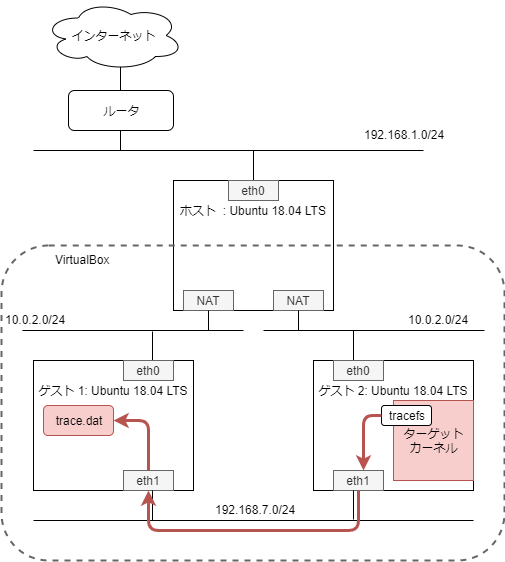
ゲスト1(dedebber)からゲスト2(debuggee)にアタッチする。
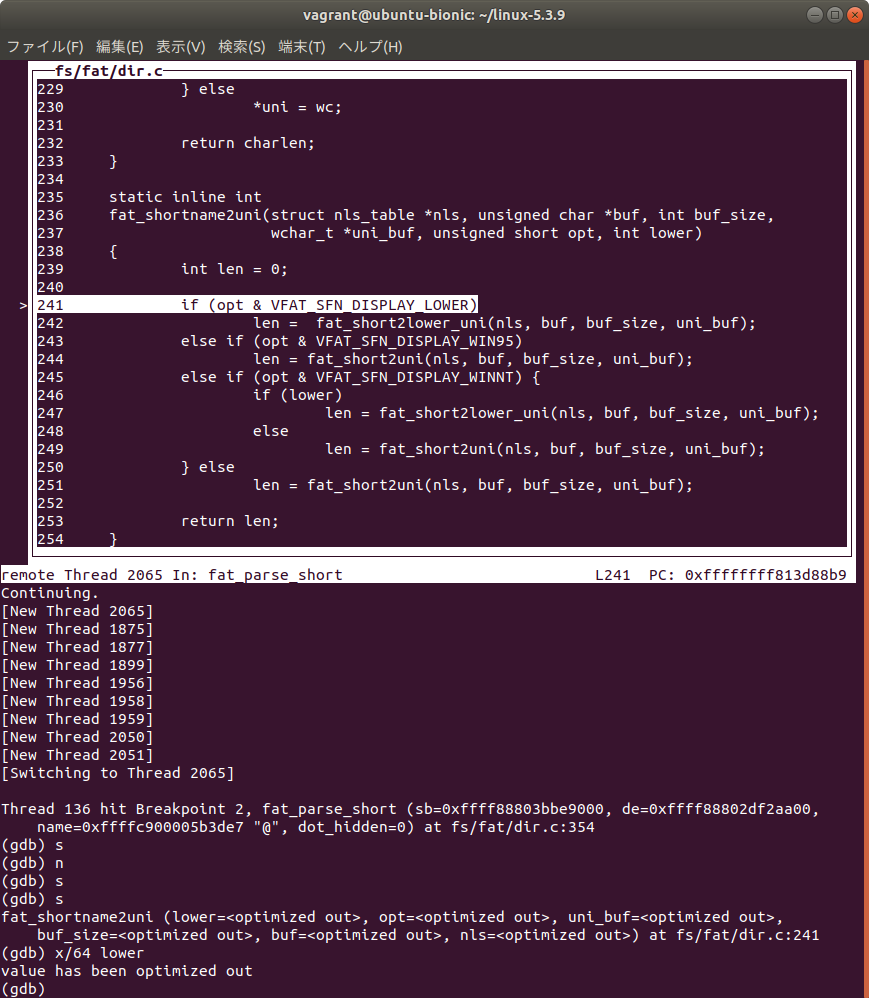
debugger:~$ sudo gdb ~/linux-5.3.9/vmlinux
GNU gdb (Ubuntu 8.1-0ubuntu3.1) 8.1.0.20180409-git
Copyright (C) 2018 Free Software Foundation, Inc.
License GPLv3+: GNU GPL version 3 or later <http://gnu.org/licenses/gpl.html>
This is free software: you are free to change and redistribute it.
There is NO WARRANTY, to the extent permitted by law.  Type "show copying"
and "show warranty" for details.
This GDB was configured as "x86_64-linux-gnu".
Type "show configuration" for configuration details.
For bug reporting instructions, please see:
<http://www.gnu.org/software/gdb/bugs/>.
Find the GDB manual and other documentation resources online at:
<http://www.gnu.org/software/gdb/documentation/>.
For help, type "help".
Type "apropos word" to search for commands related to "word"...
Reading symbols from vmlinux...done.

(gdb) target remote /dev/ttyS1
Remote debugging using /dev/ttyS1
kgdb_breakpoint () at kernel/debug/debug_core.c:1043
1043            wmb(); /* Sync point after breakpoint */
バックトレースの出力
(gdb) bt
#0  kgdb_breakpoint () at kernel/debug/debug_core.c:1136
#1  0xffffffff81167bec in sysrq_handle_dbg (key=<optimized out>) at kernel/debug/debug_core.c:889
#2  0xffffffff8164c0b3 in __handle_sysrq (key=103, check_mask=false) at drivers/tty/sysrq.c:556
#3  0xffffffff8164c58f in write_sysrq_trigger (file=<optimized out>, buf=<optimized out>, count=0,
    ppos=<optimized out=>) at drivers/tty/sysrq.c:1105
#4  0xffffffff81346dbe in proc_reg_write (file=<optimized out>, buf=<optimized out>,
    count=<optimized out>, ppos=<optimized out>) at fs/proc/inode.c:238
#5  0xffffffff812b6deb in __vfs_write (file=<optimized out>, p=<ptimized out>, count=<ptimized out>,
    pos=<optimized out>) at fs/read_write.c:494
#6  0xffffffff812b9d81 in vfs_write (file=0xffff88803b881000, buf=0x7ffe351d2710 "g\n",
    count=<optimized out>, pos=0xffffc9000053bee8) at fs/read_write.c:558
#7  0xffffffff812ba087 in ksys_write (fd=<optimized out>, buf=0x7ffe351d2710 "g\n", count=2)
    at fs/read_write.c:611
#8  0xffffffff812ba0da in __do_sys_write (count=<optimized out>, buf=<optimized out>,
    fd=<optimized out>) at fs/read_write.c:623
#9  __se_sys_write (count=<optimized out>, buf=<optimized out>, fd=<optimized out>)
    at fs/read_write.c:620
#10 __x64_sys_write (regs=<optimized out>) at fs/read_write.c:620
#11 0xffffffff8100434a in do_syscall_64 (nr=<optimized out>, regs=0x92) at arch/x86/entry/common.c:296
#12 0xffffffff81c0008c in entry_SYSCALL_64 () at arch/x86/entry/entry_64.S:175
#13 0x0000000000000002 in fixed_percpu_data ()
#14 0x0000000000000002 in fixed_percpu_data ()
#15 0x00007ffe351d2710 in ?? ()
#16 0x0000000000000002 in fixed_percpu_data ()
#17 0x00000000000001b6 in ?? ()
#18 0x00007fafef72f540 in ?? ()
#19 0x0000000000000002 in fixed_percpu_data ()
#20 0x00007fafef22f154 in ?? ()
#21 0x0000000000000002 in fixed_percpu_data ()
#22 0x0000000000000003 in fixed_percpu_data ()
#23 0x00007fafef22f154 in ?? ()
#24 0x0000000000000033 in ?? ()
#25 0x0000000000000246 in ?? ()
#26 0x00007ffe351d2628 in ?? ()
#27 0x000000000000002b in fixed_percpu_data ()
Backtrace stopped: Cannot access memory at address 0xffffc9000053c000